
Overview
Creating a blended 2D, 3D animation and evaluating its perception with eye-tracking and surveys.
Results
- Experts rated it "highly engaging".
- Eye-tracking, cued-retrospective reporting and surveys revealed distinct differences in how researchers perceived the animation, compared to novices.
Client
Director of Anesthesia Research at University of Illinois College of Medicine at Chicago
TARGET AUDIENCE
Clinical care researchers, anesthesiologists
Challenge
A leading critical care researcher and Key Opinion Leader needed a 3D animation that would engage the interest of his anesthesiology and lung clinical care researcher colleagues when he presented at seminars. A 3D animation of his research topic, the Lung Endothelial Surface Layer (ESL), would make it easier for him to explain the the dynamic molecular process of how blood flow affects the Lung Endothelial Surface Layer and causes its disintegration during inflammation. As this is an emerging area of research, this would be first animation ever created on the topic.
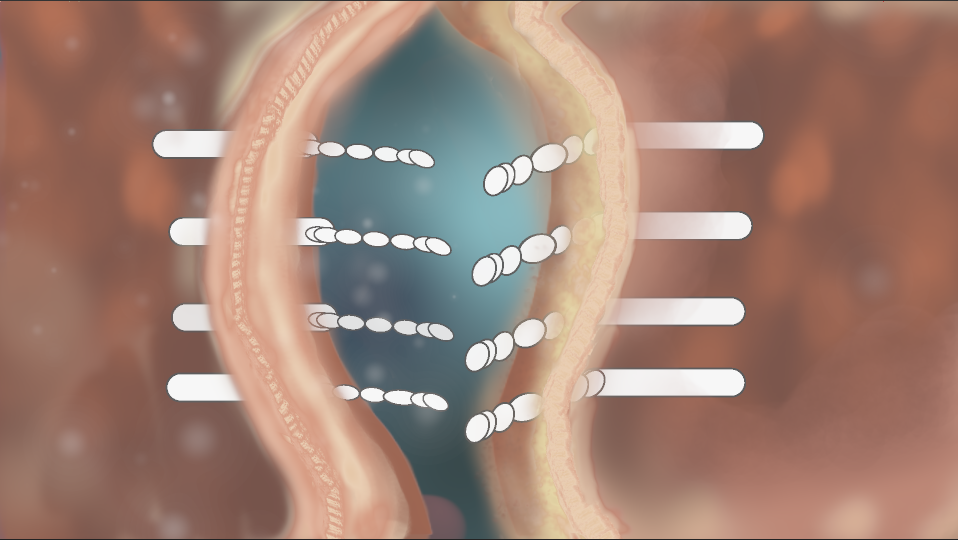
Animation used in testing
This research project was designed to create a 3D animation that would engage researchers in the Lung Endothelial Surface Layer (ESL) and to test if expertise level would influence how the animation was perceived.
Design Research
Historically, animations have been heavily influential in increasing appreciation for a topic and have been highly productive forces in the generation of scientific knowledge. To measure the effect of this animation in increasing appreciation for the topic within its target audience, we measured perception, engagement, and learning outcomes in lung researchers and biomedical visualization graduate students quantitatively and qualitatively through eye-tracking, cued-retrospective recordings, and surveys.
A script was created with the content expert. After extensive research in the primary literature on the emerging topic of the Lung Endothelial Surface Layer, a storyboard was created for the animation that blended 2D and 3D.
The storyboard ...


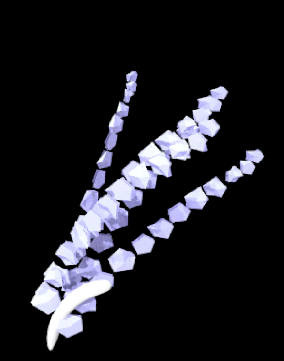


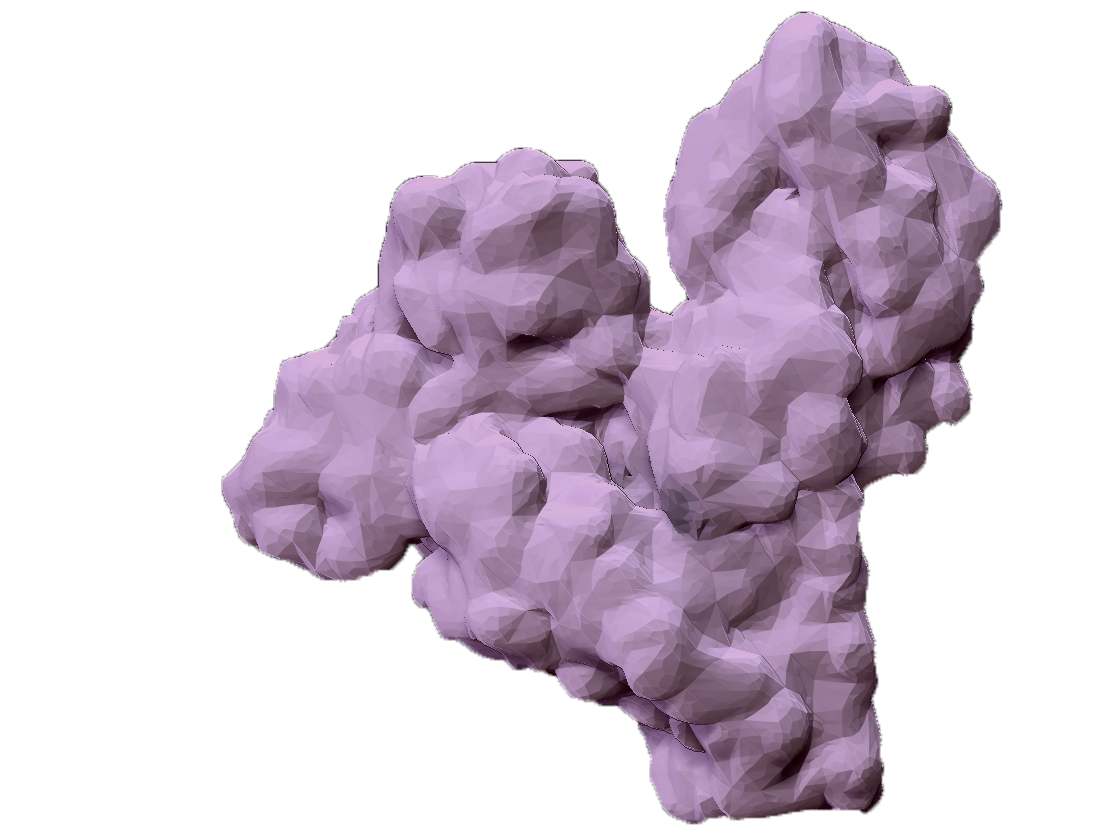


3D assets and 3D scenes were created based on known sizes ...
These included endothelial cells, arterioles, proteoglycans, white blood cells, and plasma proteins. Because the target audience had such high expertise in this area, sizes had to be accurate..
Autodesk 3ds Max, Pixologic ZBrush
2D assets were created based on microscopy images in the scientific literature ...
Such as the alveolar cross-sections, the glycocalyx, and endothelial cells.
Adobe Photoshop, Adobe Illustrator, Adobe After Effects


Testing
to gather differences in how the animation is perceived between researchers and non-researchers
... with eye-tracking,
cued retrospective recording
and surveys.
I chose eye-tracking and cued-retrospective recording ( where a recording of the eye-tracking is played back to a participant and the participant narrates what they thought motivated where they focused) because I wanted a quantitative and qualitative way to understand differences in how researchers and non-researchers understood the animation.
Areas Of Interest (AOIs)
by defining areas of the animation, called Areas of Interest, that the content expert and I both hypothesized an expert on the Lung ESL would look for information in the animation, I was able to detect differences in how researchers watched animation versus non-researchers.


Analysis and Synthesis
The eye-tracking data was filtered to Average fixations and sorted by categories. SPSS was used for graphing and analytics. The data was compared to past eye-tracking studies on chemistry animations.
Results
Subjects:
I tested 25 participants: a pool of researchers at the University of Illinois Medical College at Chicago and Biomedical Visualization graduate students at the University of Illiniois at Chicago.
Researchers' Survey Results on "Engagement"

100 % of participants increased in knowledge about the Lung ESL.
The eye-tracking and cued retrospective reporting showed that researchers viewed the animation very differently than non-experts.
When the visuals resembled representations they saw in the scientific literature, the researchers would often focus on the audio as they assumed they would be able to anticipate what the animation would show.
Eye-tracking data of a novice.
Eye-tracking data of an Researcher.
Survey Responses
“I love the idea of adding graphs to the animation. I believe it increases the scientists’ interest. I really like some of the surfaces presented, like the alveoli one. It has a good pace and the voice and animation are very well coordinated. ”
“The animation gave me a good visual to what we are studying in the lab”
“I got a much clearer idea of the structure of the glycocalyx and how it works.”
Q: Which aspects of the animation did you think were done well?
“• Lung edema, barrier function
• The detail and flow.
• The VE cadherin dissociation
• Illustration of glycocalyx
”